
What should a multi-store retail dashboard show?


Choose retail dashboard metrics by the decisions they support, with consistent definitions for stores, periods, and returns.
On this page
A multi-store retail dashboard should help a manager decide where to investigate, replenish, or support a team. Start with those decisions and trace each metric back to a reliable source. Adding more charts does not resolve inconsistent definitions.
Give each number a decision
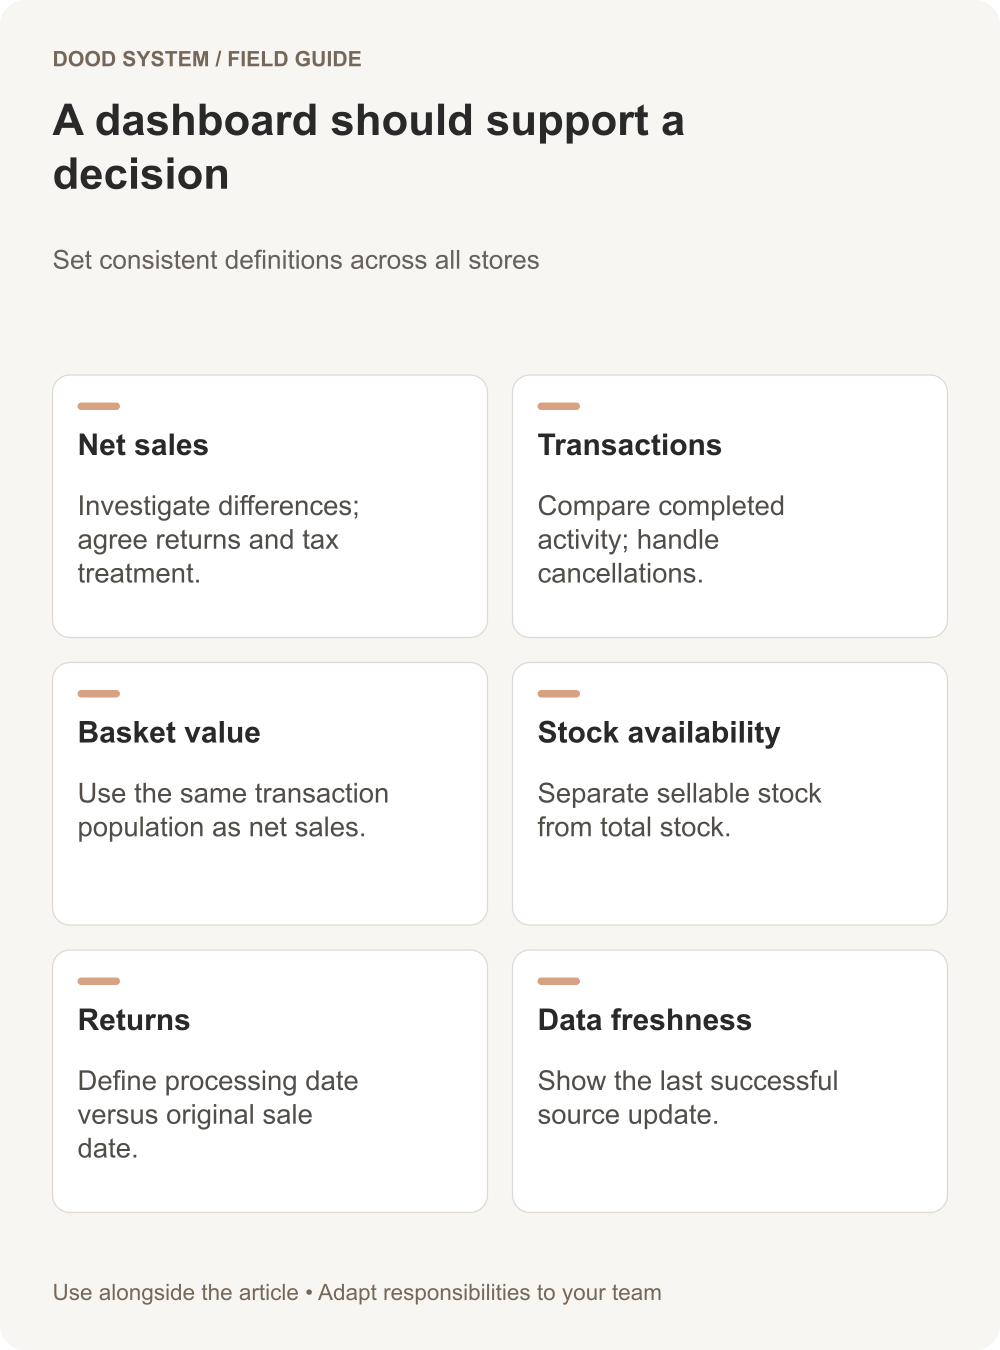
| Metric | Decision it supports | Definition to settle |
|---|---|---|
| Net sales | Which stores need investigation? | Returns, discounts, and tax treatment |
| Completed transactions | Has activity changed? | Cancelled and refunded transactions |
| Average transaction value | Has basket value changed? | Same population as the sales numerator |
| Stock availability | Where is replenishment needed? | Sellable stock versus total stock |
| Returns | Which products or processes need review? | Return date versus original sale date |
| Data freshness | Can today's comparison be trusted? | Last successful source update |
Avoid comparing one store's tax-inclusive sales with another's tax-exclusive sales. A dashboard should display the definition, not rely on the reader remembering it from a meeting.
An example of a misleading comparison
Imagine Store A reports $12,000 from 120 completed transactions, and Store B reports $10,000 from 80. Their average transaction values are $100 and $125 respectively. Store A leads on sales; Store B leads on basket value. Neither figure by itself explains margin, footfall, staffing, or customer experience.
If Store B has not synchronized the final two trading hours, the comparison is also incomplete. Show a freshness warning rather than silently ranking stores on uneven coverage. These amounts are illustrative, not client results.
Separate operational and reconciliation views
Managers may need an intraday view for action and a closed-period view for reconciled reporting. Label provisional data. Keep a path from a summary number to the underlying transactions, and assign an owner for investigating differences.
Odoo's POS reporting documentation describes reporting on POS orders and sessions. A multi-store model still needs consistent identifiers, business-day rules, and interpretation across sources.
Test the edge cases
Use a sale followed by a later return, a closed store, a delayed sync, and a product available in only some locations. Decide how each appears before launch. Show zero, unavailable, and not applicable differently; they represent different situations.
Start with a small set of decision-linked metrics and a visible data-quality panel. Expand only when a manager can explain the action that another number will support. For a practical brief, explore our store dashboard blueprint or discuss a reporting prototype.